All Courses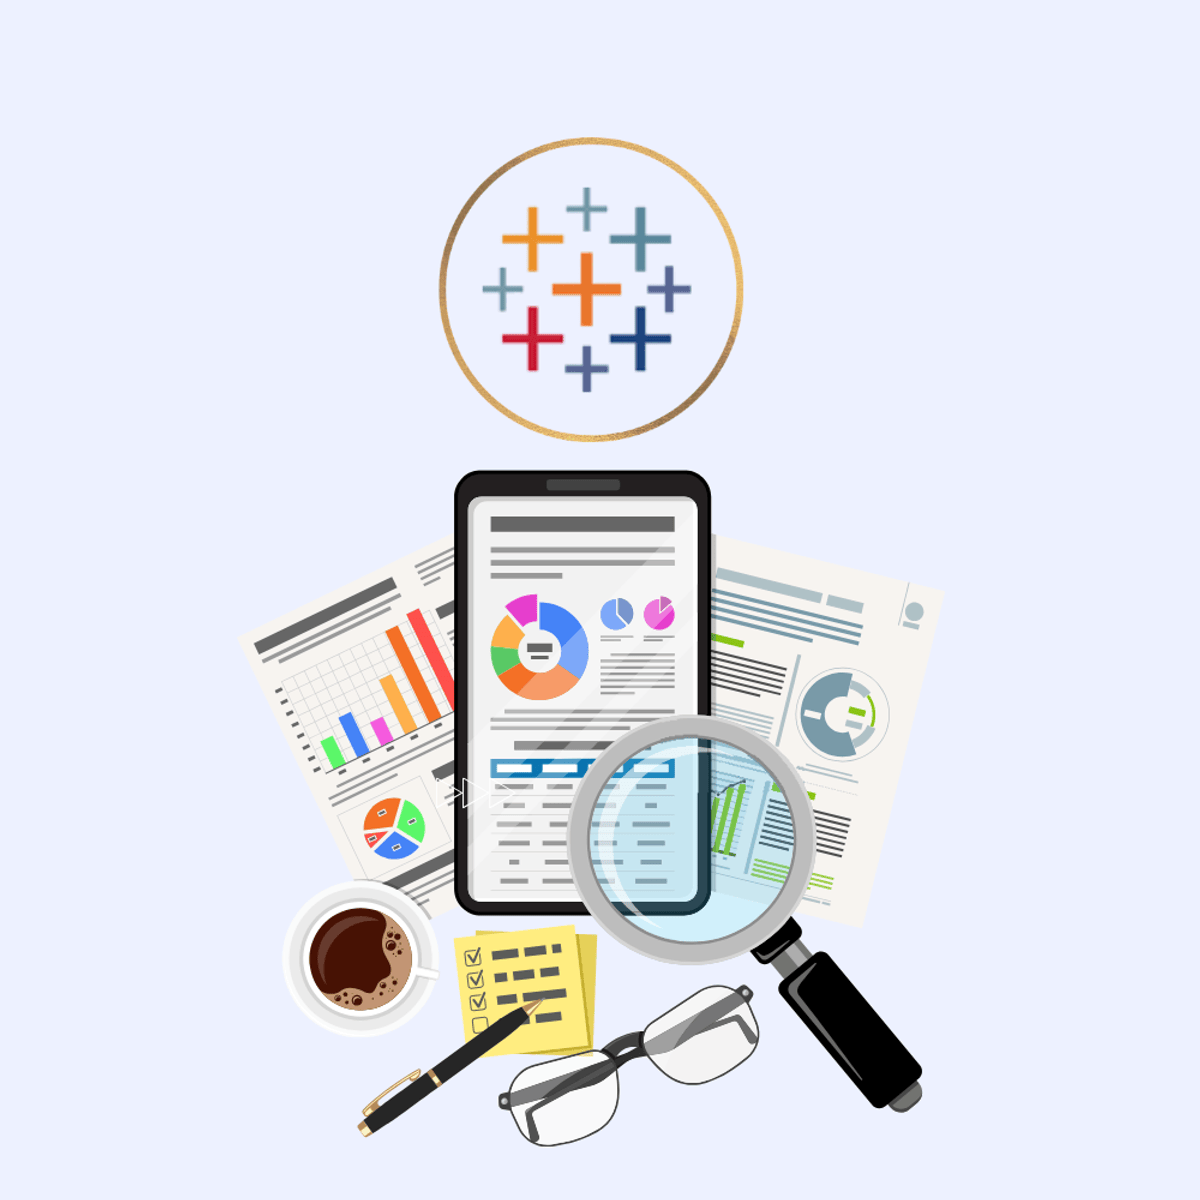
About this Course
Data is powerfulâonly if you can see the story it tells. This Tableau course will take you from raw data to spectacular visuals and dashboards that make an impact. You'll start by understanding the essentials of integrating data sources, working with data types, joins, relationships, and blending. Then, by using filters, sets, parameters, and calculations, you can refine and analyze your data. Through immersive demos, you'll see how Tableau brings insights to life through chart types, level
What You'll Learn
- Explore Tableau’s interface to connect data and build visualizations
- Clean, shape, and blend data for accurate visuals
- Create insights using charts, maps, and interactive features
- Build interactive dashboards to support data-driven decisions
Instructors
L
LearnKartS
Topics
Dashboard
Trend Analysis
Data Visualization Software
Tableau Software
Data Modeling
Pivot Tables And Charts
Geospatial Information and Technology
Course Info
PlatformCoursera
LevelUnknown
PacingUnknown
PriceFree
Skills
لوحات التحكم
تحليل الاتجاهات
برامج عرض البيانات
برنامج Tableau
نمذجة البيانات
الجداول والمخططات المحورية
المعلومات الجغرافية
إعلان
إعلان